Purpose-built for E-commerce
Everywave is built on the practices and principles of world-class DTC and omnichannel brands.
Powered by AI agents
Our agents use the most advanced AI models to uncover insights and spot hidden opportunities.
Designed for speed
Get the insights you need quickly—without drowning in dashboards or waiting for weekly reports.
Everywave connects seamlessly with Shopify, Klaviyo, Google Analytics, Meta and more to help you find the answers you need without jumping between tools, manual data exports or digging through spreadsheets.
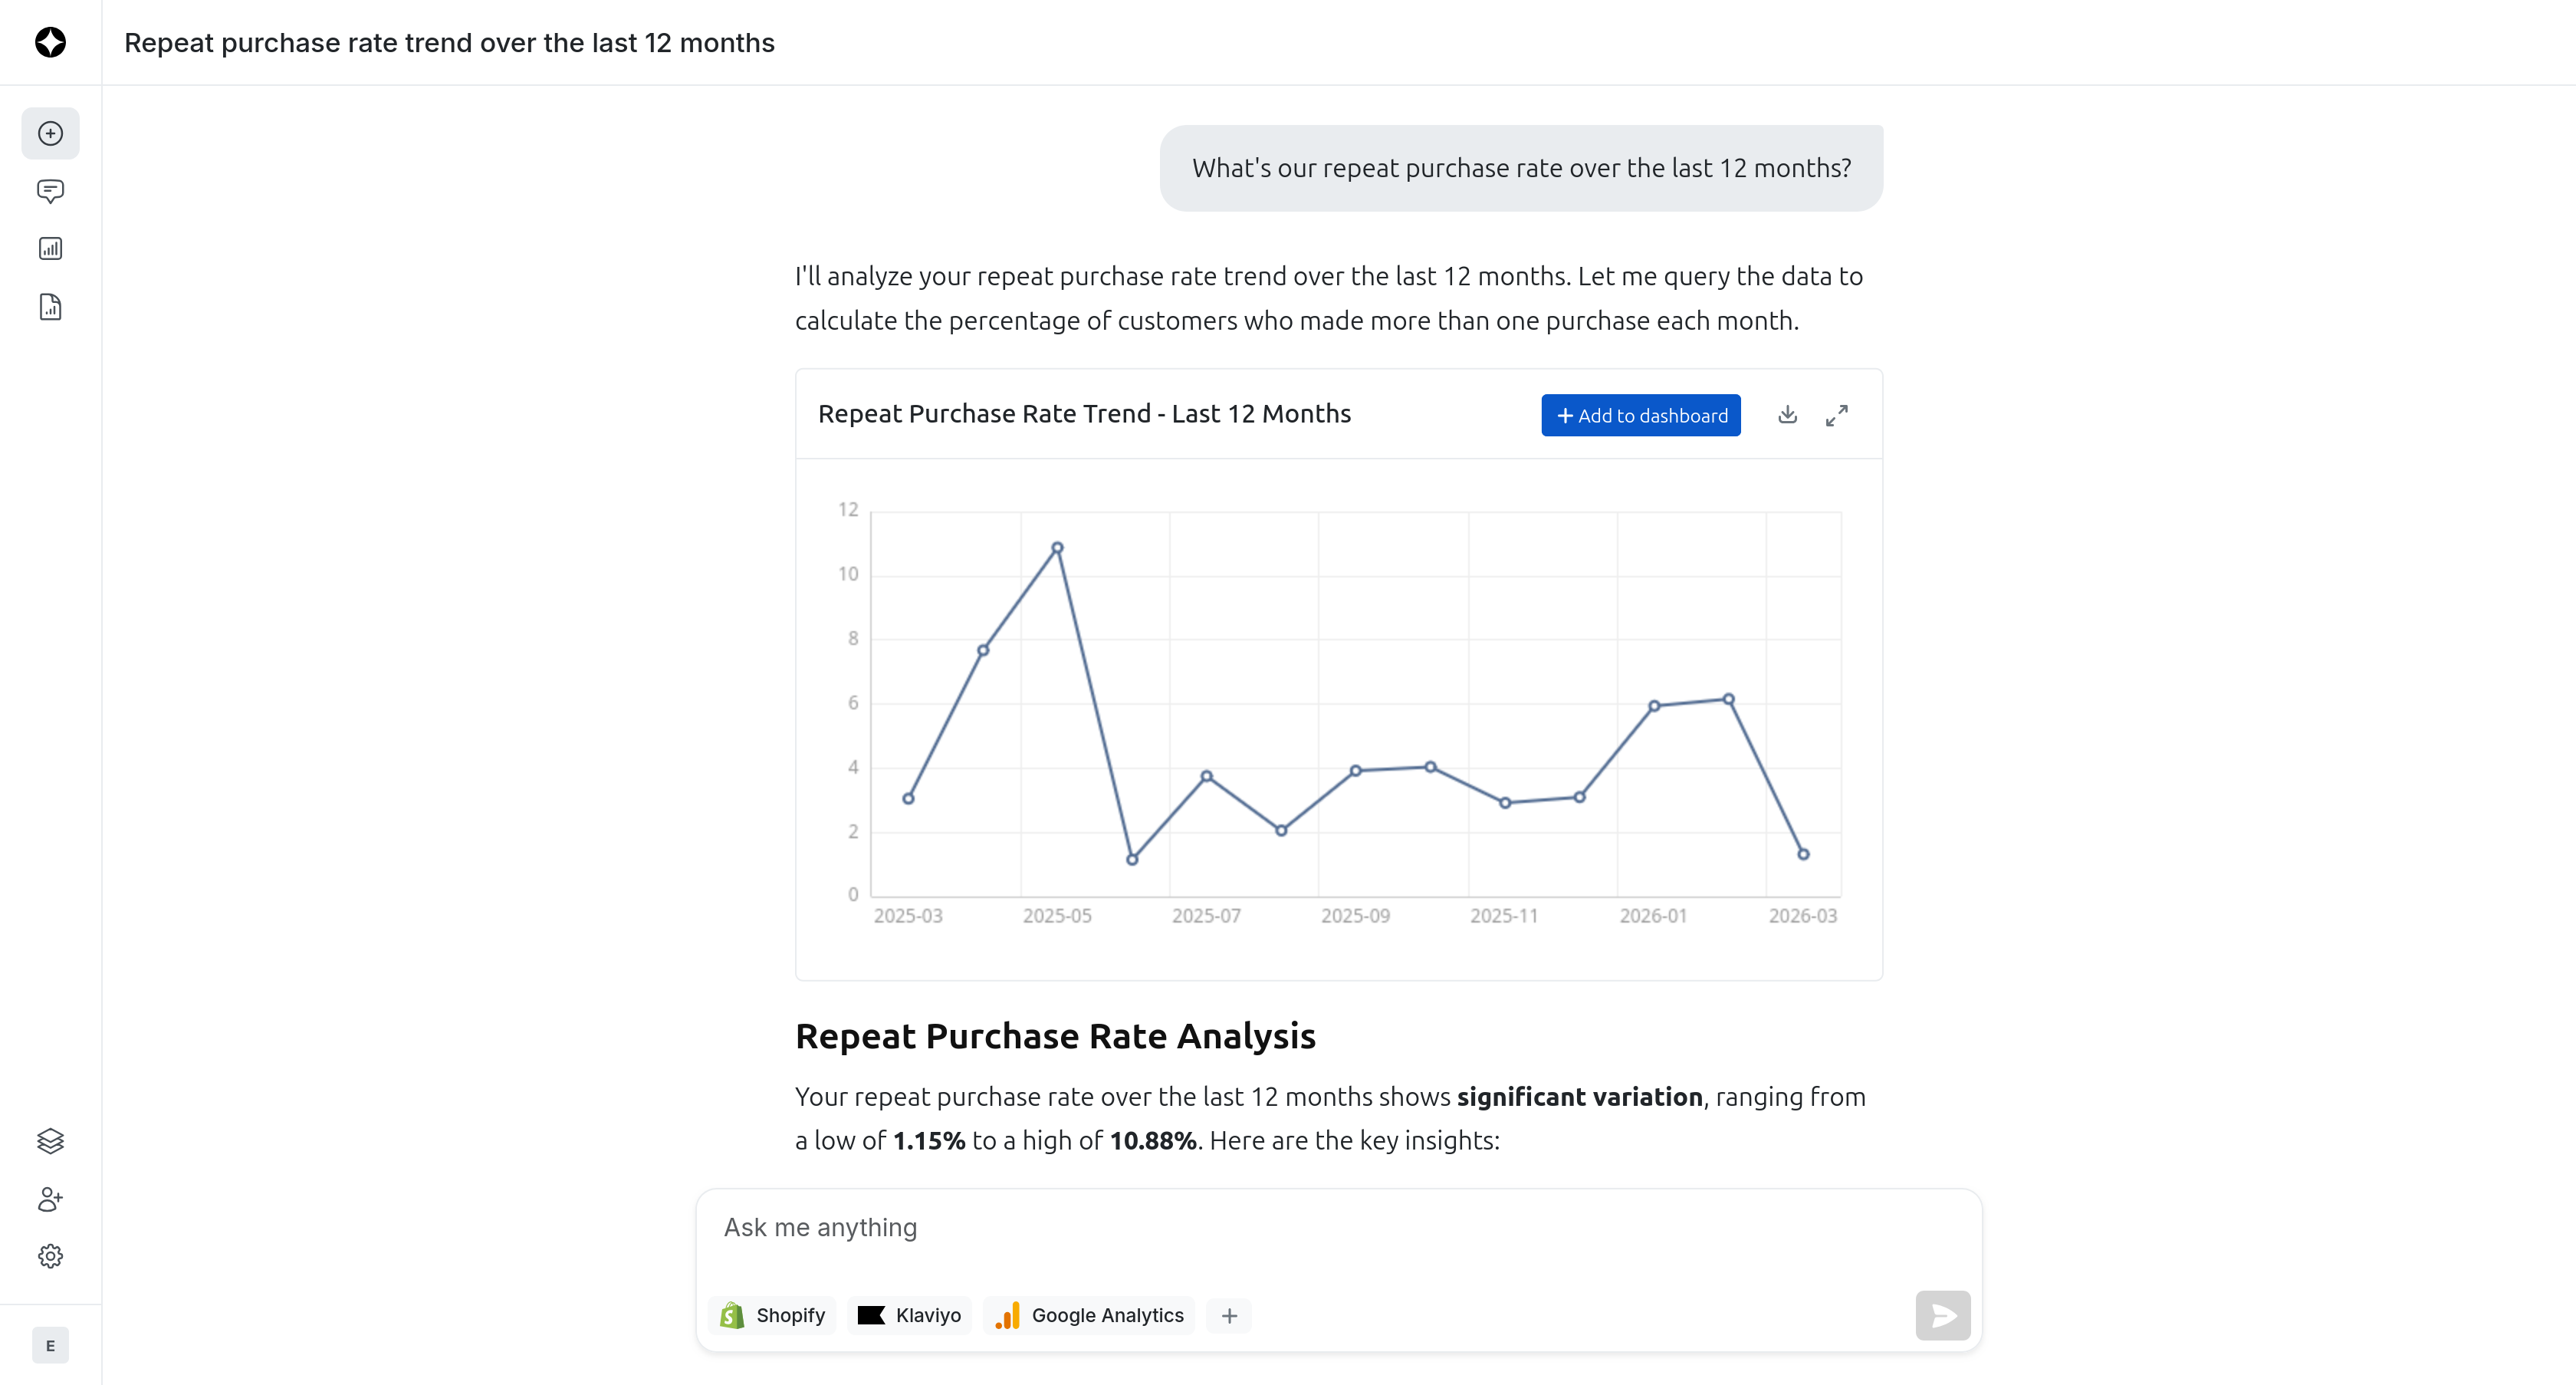
Analyze cross-channel performance using natural language. Ask questions, follow up on threads, and let Everywave do the deep research across your entire stack to find the answers.
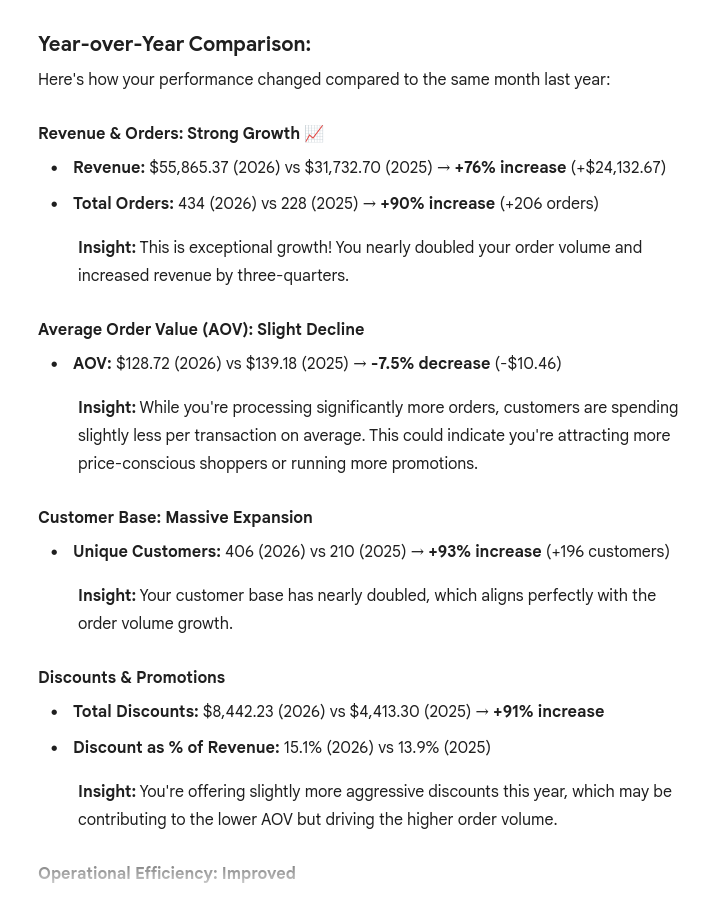
Instantly visualize trends, spot errors, and uncover hidden performance gaps. Everywave doesn't just give you raw numbers—it highlights growth opportunities and delivers practical, step-by-step recommendations to improve your strategy.
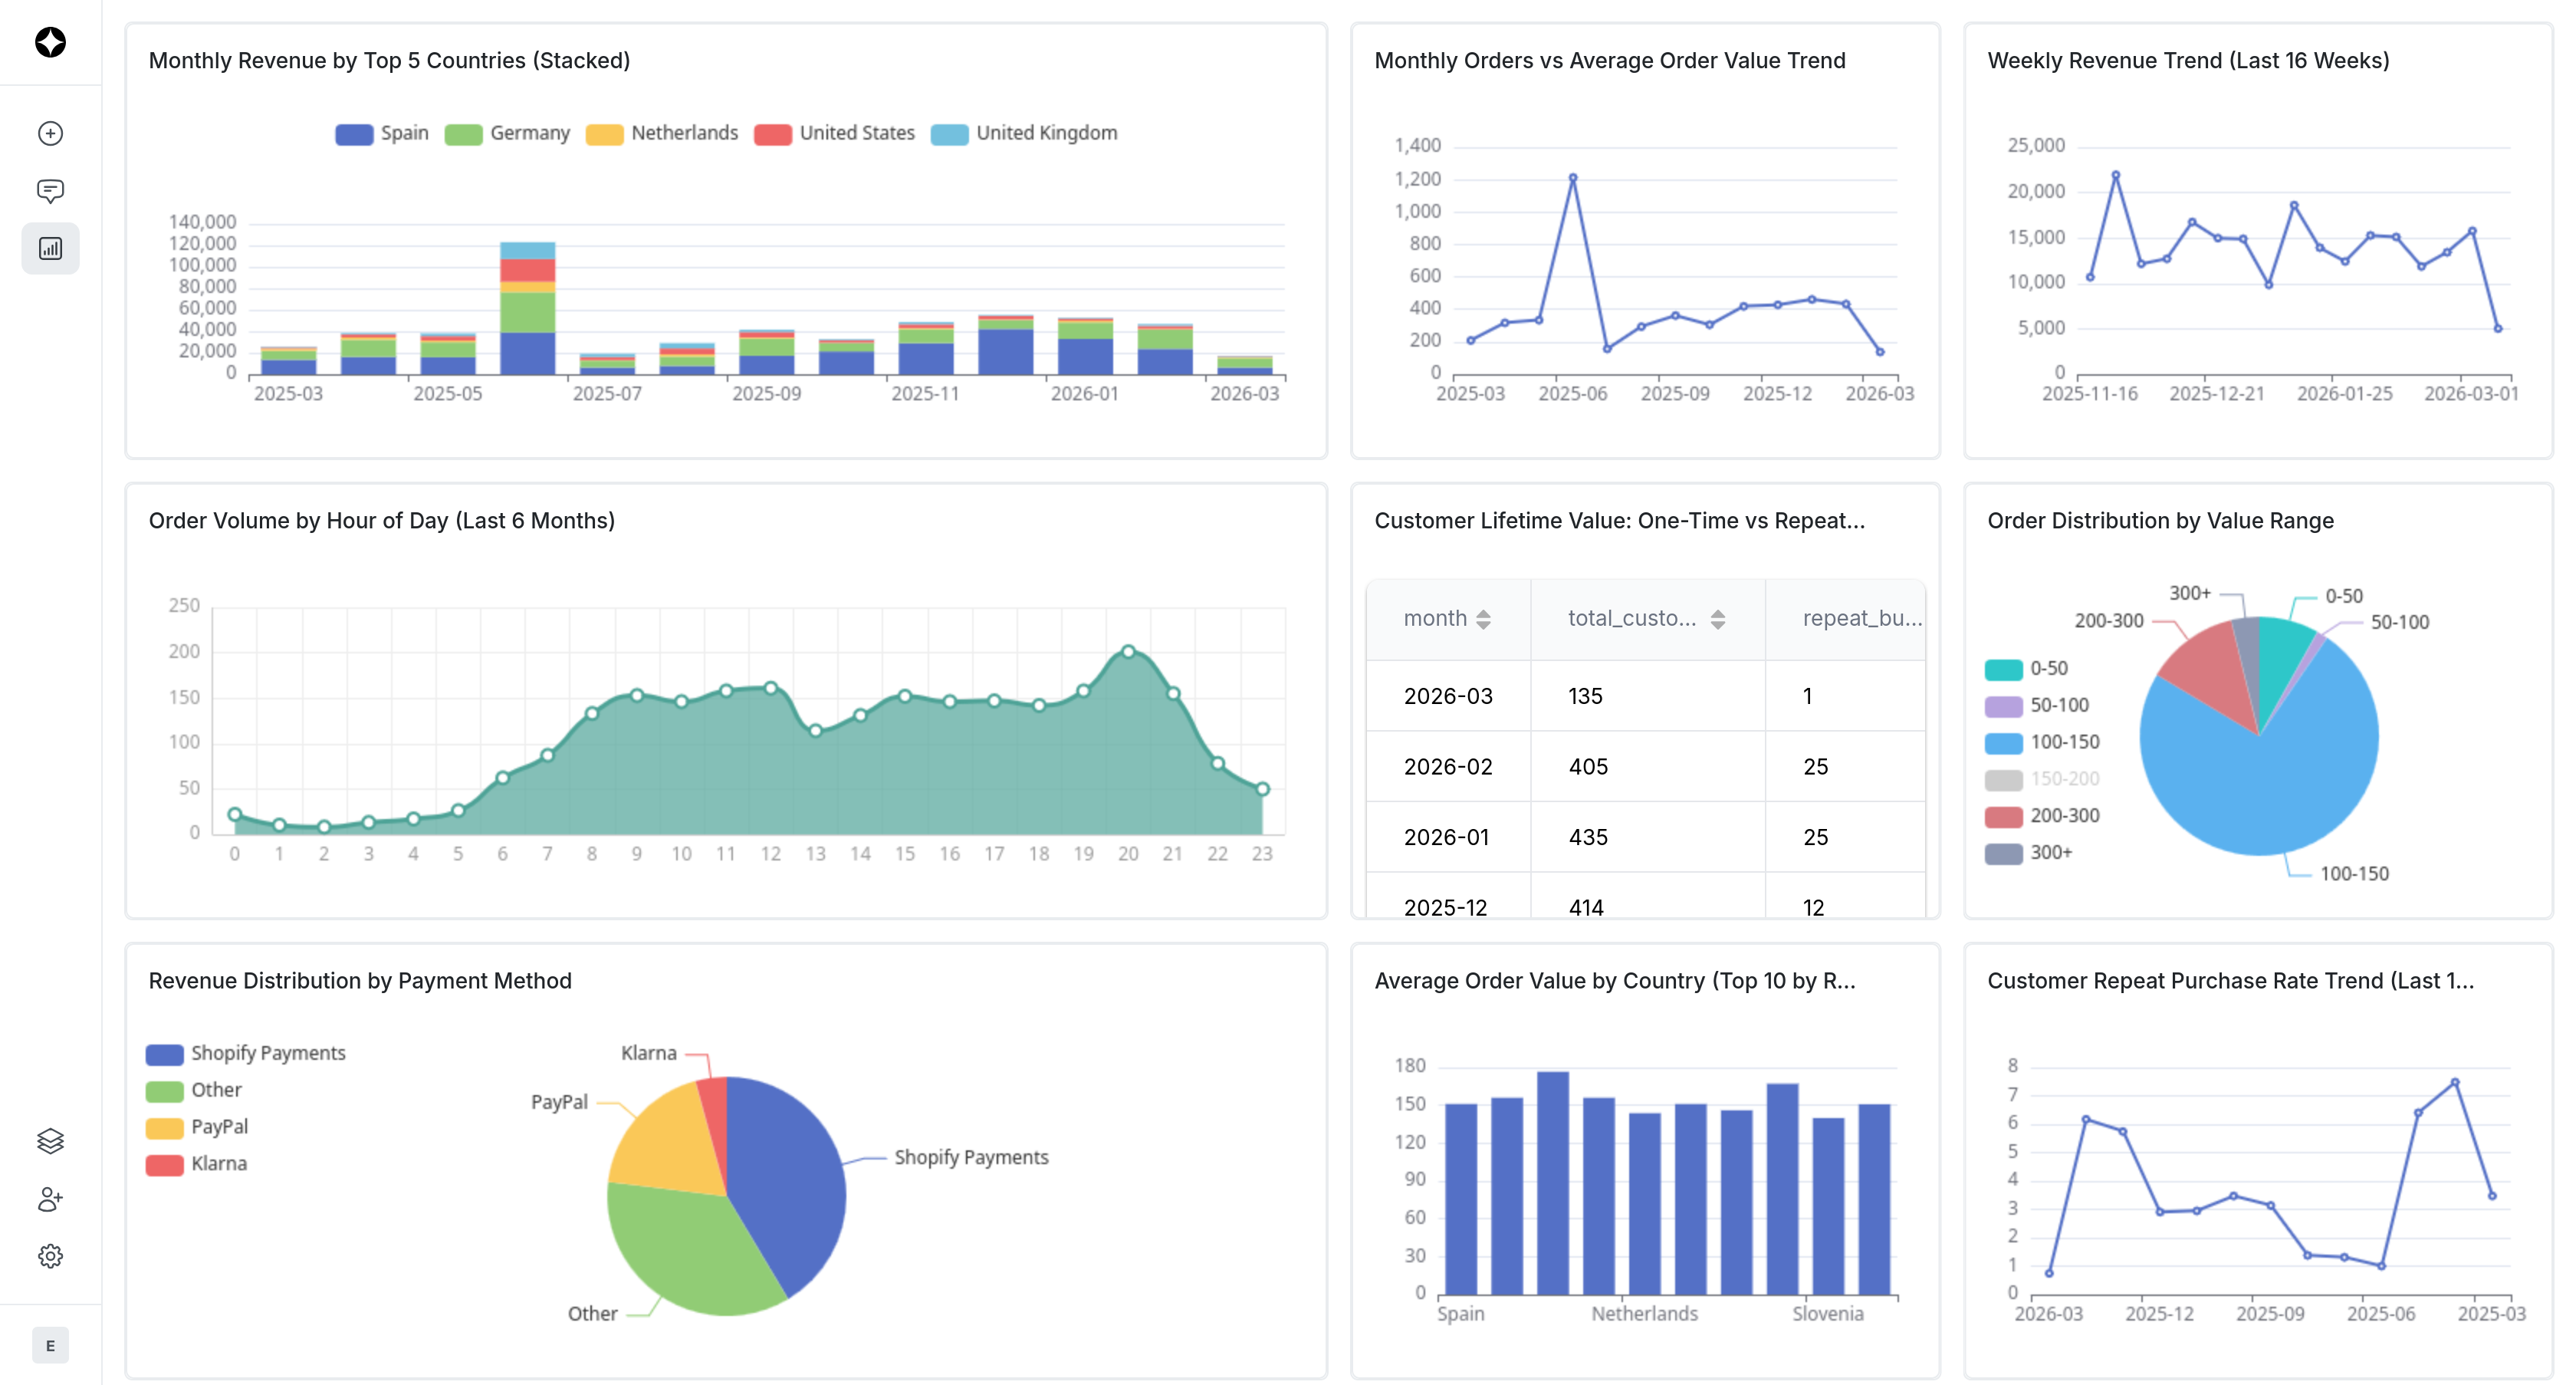
Everywave turns one-off answers into interactive, auto-updating reports. Build interactive charts in one click and share live dashboards to keep your entire team aligned on the latest metrics.
Unlimited users
Bring everyone on board. Invite as many teammates as you want to your workspace so the whole company can make data-driven decisions. No per-seat pricing.
Hands-on support
Email, Slack and whatsapp support. Get up and running fast. We'll guide you on how to get the most out of Everywave and automate your tedious data tasks for good.
Private by design
Your business data belongs to you. Everywave uses enterprise-grade encryption, and your proprietary data is never used to train our foundational AI models.